Dashboard & Insights That Drive Action
See the full picture and act on it instantly — with real-time data that powers smarter decisions.
What It Is & Why It Matters
When you can’t measure training effectively, you can’t improve it. Dashboard & Insights transforms scattered course data into a single, live view of progress, completions, and engagement. This means managers can make decisions based on facts, not guesswork.
How it Works in SincX Learn
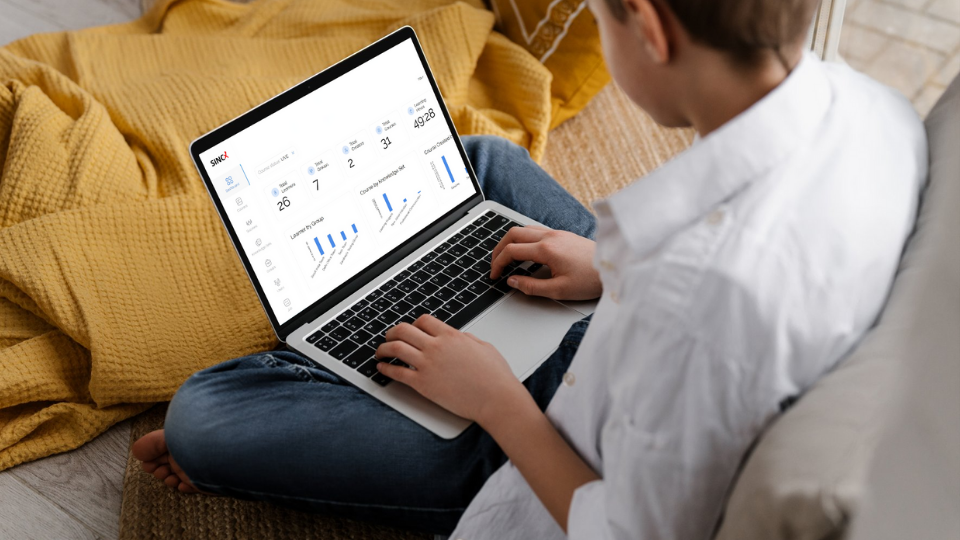
Live dashboards for course completions, learner activity, and skill progress.
Filters to view by group, course status, library, and more.
Trend analysis to identify strengths and gaps.
Export reports for leadership or compliance reviews.
Real-World Impact
A hospitality group noticed declining engagement in their guest-service course at certain properties. The dashboard flagged the trend early, and targeted interventions restored 100% completion within 10 days.
Turn Data Into Smarter Decisions
Give your teams the clarity to act fast, improve performance, and stay ahead with insights that matter.
Frequently Asked Questions
You can track completions, learner activity, skill progress, and engagement trends – all in one live view.
Yes. Filters let you drill down by role, department, or course, to see exactly where progress is on track and where gaps exist.
By spotting dips in engagement or skill gaps early, you can adjust content or provide support before it impacts performance.
Absolutely. Reports can be exported instantly for compliance, leadership updates, or board reviews.
Yes. Trend analysis highlights improvements, recurring challenges, and areas that need targeted attention.
It’s widely used in hospitality, manufacturing, construction, retail, logistics, non-profits, and franchises – anywhere consistent training and compliance are critical.